I’m Tony Heller, aka Steve Goddard, a climate denier blowing the whistle on myself. If you’re not familiar with me, see here.
It’s the most wonderful time of the year for the several dozen climate deniers who gather together to reinforce their stupidity and swap boner pill tips at the Heartland Institute’s International Conference on Climate Change. This year’s conference was held at the Trump International Hotel, because there’s no better place to signal that you’re science has absolutely nothing to do with politics.
One of today’s speakers at the conference was Dr. Roy Spencer, who helps lead the satellite temperature measurement project at the University of Alabama, Huntsville. Spencer has spent a large part of his career desperately trying to prove his peers couldn’t possibly be right about climate change because God. We could rattle off bunches of other links showing your what a fraud he is but you can Google that just as well as we can.
Our main purpose today is to introduce a new feature, “Refute a Denier,” where we crowd source the collective intelligence of people who know what they’re talking about to refute the claims of climate deniers. In the hot seat is, of course, Dr. Roy Spencer, and the presentation he gave today at Heartland’s conference. During his talk, he claimed that most climate models ran much hotter for the troposphere (which is not the same as surface temperature data) than the satellite record.
To make it super convenient, we created a video of his presentation along with the entire transcript and screenshots of the slides he showed during his talk. Feel free to post your comments on Twitter, in the comments below, on YouTube, or on your own blog post. We’ll collect them all when we do a roundup.
Please have at it!
Good morning. Isn’t this a great venue? Several of us were talking that this is
the nicest hotel we’ve ever stayed in, ever. Which is probably out of the
people I talked to, that’s a cumulative 1000 people years of traveling.
Um, you’re gonna hear some differences of opinion on the details here. I’ve
noticed already based on the talks during breakfast, but I think we’re the
people here that will be speaking or unified in one basic message. And that is
there is no climate crisis. There is no climate emergency. Okay, that we’re in
agreement on that, but we can argue about the details.
Um, sometimes it’s hard to get your hands around the climate subject. You know,
global warming, climate change, what we should do about energy policy. There’s
a lot of weeds you can get into. Okay? And so a lot of people just threw up
their hands and they go along with whatever the scientific consensus is or with
the policy consensus is or whatever Al Gore says.
So I’d like to give you some advice to help hopefully make things a little
easier. Try to think of all of the talks that are given today, as something
that’s in one of three categories. There’s sort of three categories of issues
that that we’re gonna be speaking on.
The first category I’m going to briefly address is “Is climate changing?” Okay?
Is there a changing climate, whether it’s warming or increasing storminess? And
related to that, you know, you could have changed that’s positive as well as
negative. For instance, a lot of people don’t know that damaging tornadoes are
down 50% since we started monitoring them in the 1950s. Okay, that’s the long
term trend, down 50%. You wouldn’t know that from listening to the media every
time a tornado hits a town. Right? Okay, so this is number one. How much is
climate changing? And is it good or bad?
Uh, number two. To the extent that climate is changing, how much is due to
humans? That’s something that, uh, Nir Shaviv will talk in the second talk.
He’ll talk about alternative explanations other than CO2, okay, for causing
climate change.
And then number three is the policy issue which will be addressed a lot today.
Uh, how much can we affect climate by changing energy policy? And if we do
that, what is the cost for his benefit? You know, a lot of people say, well,
you know, we just shouldn’t be affecting the climate system at all and so just
as a matter of insurance policy, you know, we need to invest the extra money
into into not producing CO2 emissions, right? Well, the trouble is, it’s so
expensive and impractical that the insurance policy…you wouldn’t have an
insurance policy on $100,000 house, let’s say a house that cost $100,000. You
wouldn’t pay $200,000 a year on an insurance policy in case your house burns
down, right? I mean, the costs outweigh the benefits.
So those are the three categories. Is the climate…how much is the climate
changing? Okay, number two: How much of that changes due to humans? Number
three: What can we do about it? And what of the costs versus the benefits of
doing something about it? So now I get into my talk.
I have relatively few slides, they asked me, Heartland asked me to cover
global temperature monitoring with satellites. We don’t monitor surface
temperatures, which is where people live. We monitor the troposphere. The
troposphere is the lowest part of the atmosphere. If you look at that little
red bracket there, it’s down…it’s where all of the weather occurs. It’s where
80% of the atmospheric mass resides outside of the tropics. 90% of the mass in
the tropics is in the troposphere.

And why do we monitor that? Well, for one thing, it’s easy to do from
satellites. Surface temperatures are much harder, okay. But also there’s a good
reason for understanding how the climate system works and whether CO2 is
causing warming. And that’s because the whole CO2 two theory of global warming
involves infrared radiation. Okay, that’s the energy given off by the Earth to
outer space. It’s how the earth naturally cools itself. Okay, and as we add CO2,
the theory says, we’ve reduced the ability of the Earth to cool itself by
about 1%. That’s according to theory, not measurements. None of our satellite
measurements of any kind are good enough to measure that. It’s a theoretical
expectation.
So anyway, that infrared radiation, it mostly comes from the troposphere so it
makes sense that we monitor the temperature of the troposphere. Also, it’s a
more robust signal. The climate models that they run all around the world
claim that warming should be greater up in the troposphere. Uh, then down here
at the surface. So it’s a more robust signature that we should be able to see.
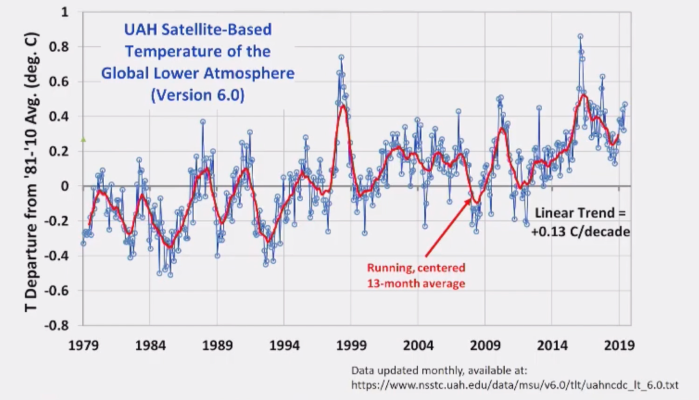
So let’s get to what we do with the satellites. For over 25 years now, John
Christie and I have been producing a temperature data set–we update it every
month–of the lower tropospheric temperature and basically the whole tropospheric
temperature. They’re two different products. And this is a plot. Since 1979
it’s ah, now over 40 year satellite record that shows how temperatures have
changed over that 40 years. There has been basically a linear trend upward with
a lot of year to your variability. But the trend is only 0.13C per decade.
Okay, that’s pretty small, you know, that’s 1/100th of a degree per year,
average warming. Okay.

Now, this is the money slide. That spaghetti plot shows yearly temperatures
from 102 different climate model runs which represent about two dozen different
climate models because you can do different runs, different experiments, in the
same climate model and get a different answer. This has a total of 102 on it.
That black line is the average of all the 102 model runs, and this is again,
this is the global average, lower tropospheric temperature. This is what we
monitor, and which I showed previously here. Okay, this is the monthly stuff
from the satellites, global average, lower tropospheric temperature variations.
Here it’s now average to yearly. Okay? And so that previous slide that’s the
blue line, our UAH satellite data, shows the least amount of warming. At least
it looks like it on this plot. There’s another group called Remote Sensing
Systems, RSS, that has there now revised estimate from the satellites, which
shows somewhat more warming than we do. That black line is the average of all
102 model runs. That black line represents what energy policy is based on,
energy policy changes. It’s based on those climate models being correct. Okay?
Now also showed on here is the average of four reanalyses. Reanalyses are
global data sets where they’ve thrown in all the observations they can find.
Surface temperatures, weather balloons, commercial aircraft, ships, buoys, a
variety of satellites, measuring all different kinds of things and then using
physics to sort of estimate based on all that information, their best guess of
what’s going on in the climate system. And you can see that those reanalysis
data sets agree with the satellites: that the climate models are producing too
much warming. Compared to our data set, the UAH satellite data set, it’s about
twice as much warming of the lower troposphere in the climate models compared
to the observations. And again, those climate models is what proposed energy
policy changes are based upon.

Now, if we look at the trends for each one of those curves, there’s a linear
trend that each one of those curves will have in terms of a warming rate per
decade. And I rank them, if I rank them from the warmest on the left to the
coolest on the right, this is what we see. Um, the model with the most warming
is the NOAA GFDL model. That’s the Geophysical Fluid Dynamics Laboratory of
NOAA. It’s got about 4/10 of a degree see warming per decade. That’s at the far
left. Then there’s four Canadian models having lived on the border of Canada
for many years, I would say that’s probably wishful thinking on their part. Um,
the rest of the great bars or all the other 102 models. That black bar
in the middle. That’s the average of all the models. And then over
there on the right, you see this rapid fall off in warming trends all the way
over at the right. The one model that has the least amount of warming and is
actually closest to UAH, to our data set, is the Russian model, uh, and then
comes up the Japanese model, the MRI. The four reanalyses there next in the
green remote sensing systems has the red there. But you see that the reanalyses again agrees more with satellites than with all of these models. You
know, it makes you wonder, what are these modelers thinking?
And since I will be accused of this anyway, since I’m accused of everything
else, I want to point out how well our collusion between Vladimir Putin and UAH
worked out here. Notice that we got very close to the Russian model as
intended.

Okay, now we can do this whole thing again just for the tropics. It turns out
the tropics is where you really see the supposed effect of global warming.
Okay, you might have heard of the tropical hot spot. The tropical upper
troposphere is supposed to warm more than just about anywhere based on the
climate models. And we see even a bigger discrepancy between the observations
and the climate models in the tropics. In our case, 2.4 times as fast. That’s
how much faster the average climate model is warming compared to the UAH
satellite. And you see the reanalyses, that’s a another observational data set,
the analyses, agree with the satellites. It’s not warming as much as the
climate models say it should be.
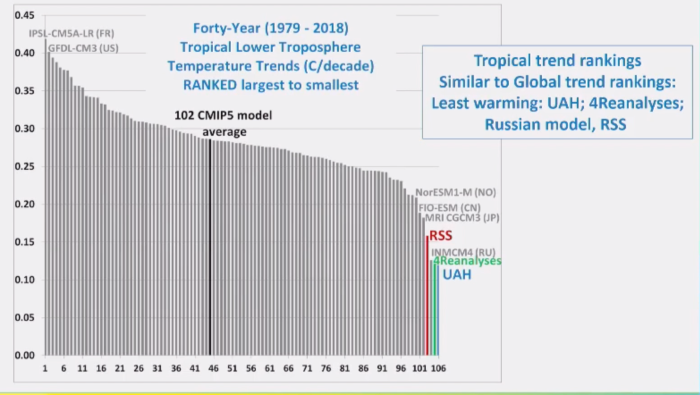
And we can do this same ranking the warming trends from all of those curves.
Here we see UAH all the way at the right there. The least amount of warming is
our data set, and the four reanalyses and the Russian model all basically agree
on tropical warming on being about half or even less than half of the average
climate model.

This is what our satellite data set looks like for the regional trends. This is
sort of, at least qualitatively, if not quantitatively, agrees with the surface
data that there’s virtually no warming at the South Pole. And as you proceed
northward, you get more and more warming with the greatest warming at the
highest northern latitudes. And this is what you’d expect for any kind of
warming whether it’s human caused or natural. Because as you proceed north from
the South Pole to the North Pole, generally, you have more and more land. You
know, the Southern Hemisphere is mostly ocean, the Northern Hemisphere is
mostly land, land warms faster than ocean. So no matter no matter what’s
causing warming, you expect this kind of pattern. You also expect there to be
somewhat more warming over the land masses than the ocean masses, um, for the
same reason.
So I’m actually going to finish early, give near Nir some extra time on his
talk, um, because he needs it. I saw all how many slides he had.
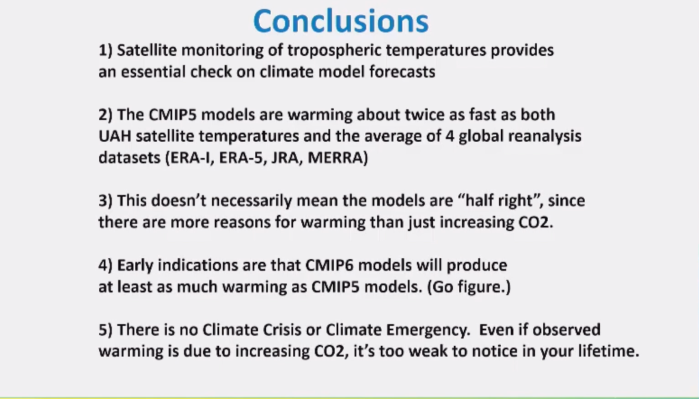
So, um, okay, conclusions. Satellite monitoring of tropospheric temperatures
provides an essential check on climate model forecast. I could tell you a lot
more about the reasons why there’s a disagreement. We’re funded, UAH is funded,
by the Department of Energy to examine the reasons between for the discrepancy
between models and observations in the tropics. And we have some answers on
that but that’s not what I was asked to talk about today. Uh, clearly, the
main conclusion here, it’s really important for policy, is that these models
that policy is based on have problems. Okay. Uh, they’re warming too much. Not
as much at the surface, that wasn’t part of what I was asked, and I hope
somebody else will discuss that today. There’s more agreement at the surface
between models and observations, but if you look closely a data sets, you’ll
find that there’s an increasing divergence now between the models and the
observations in the last 10 or 15 years. Plus, there’s some questions about
service data sets and that will be addressed by someone today. Whether we can
even believe the surface temperature data sets. Every time they do new
adjustments to them, they come up with more and more warming, as if they’re all
competing with each other to see who can get the most warming out of their
surface data set.
Okay. Now, just because the observations show half as much warming as the
models doesn’t mean the models were half right. Okay? Because the models only
produce warming from increasing CO2 and that’s the way they were designed. The
temperature change in anything–whether it’s the climate system, a pot of water
on a stove, your body, your car engine, anything–a temperature change is a
result of an imbalance between energy coming in and energy going out. All
right. Well, for the Earth, we don’t know the energy flows in and out of the
climate system to the accuracy needed to know whether the climate system is
naturally in energy balance. So what the climate modelers do is they program
the models with the assumption that there’s a balance in other words, the
assumption of no natural climate change. Then they add CO2 and the model warms
and they see, say, “See, we proved so two causes warming.” Well, duh. It’s what
you assumed to begin with. Okay.
Alright. Early indications they’re now doing, CMIP6 climate models what I
showed you was everything was from CMIP5 climate model runs earlier,
Indications are that the semen six models are have even more warming, then the
CMIP5 models. I don’t know why they’re just ignoring the observations.
And finally, what I started out with there is no climate crisis. There is no
climate emergency. Even if all of the warming we’ve seen in any observational
data set, is due to see increasing CO2, which I don’t believe it is, uh, it’s
probably too small for any person to feel in their lifetime, and I’ll leave it
at that. Thank you.

Any advocate of “intelligent design” who believes the earth is 6000 year old has no business calling himself a scientist.
LikeLiked by 3 people
Only intellectual cowards reply with slander.
LikeLike
Then pretty much every climate change denier online is an “intellectual coward” (to use your non-intellectual term).
LikeLike
I make over thirty k a month working part-time. I kept hearing from other people telling me how much money they could make online, so I decided to find out. Well, it was all true and it completely changed my life.
This is where I started…. http://WorkStar24.blogspot.com/
LikeLike
That is only your unproved opinion & not a scientific fact. Only God & Jesus know the age of the universe & earth. FYI- Before the foundation of the world the “LAMB OF GOD(JESUS) WAS SLAIN”… It is in the bible & is GOD. word. Direct your comment to GOD.
LikeLike
God, you are wrong as the bible is a message of faith and not Historical Geology
LikeLike
Heads up – there is no “god”. That is only your unproved opinion & not a scientific fact.
LikeLike
[…] über It’s Time to Play „Refute a Denier,“ with Dr. Roy Spencer — Tony Heller (aka Steven Goddard)… […]
LikeLike
Spencer repeats the same distortions he and his UAH colleague John Christy have used for years. I have a couple of blogposts covering them. I’ll also summarize some of the main points, in case people don’t want to read those posts:
http://blamethenoctambulantjoycean.blogspot.com/2017/07/myth-santer-et-al-show-that-climate_28.html
http://blamethenoctambulantjoycean.blogspot.com/2018/01/john-christy-fails-to-show-that-climate_14.html
1) Spencer leaves out radiosonde analyses, likely because they show more warming than the re-analyses and UAH analysis he presents. So Spencer cherry-picks to under-estimate warming.
2) Spencer and Christy argue that their results show that climate models over-estimate climate sensitivity. That explanation makes little sense. A more plausible explanation that better fits with the evidence, is that the radiative forcings inputted into the models were larger than the radiative forcings that actually occurred. This would not be an error in the models themselves; it would not be an error in their climate sensitivity. That, combined with making sure one does an apples-to-apples comparison of models vs. observational analyses with respect to trends for the sea surface and near-surface air above land, explains the vast majority of differences between the trend in the model-based projections vs. the observational analyses.
Points 2A to 2C below support this forcings-error explanation, while points 2B to 2G undermine Spencer and Christy’s explanation:
2A) An error in forcings accounts for discrepancies in surface temperature trends; this explanation also extends to the bulk troposphere, in large part due to surface warming rising to the bulk troposphere, especially in the tropics, and climate models accurately representing the ratio of surface warming vs. bulk tropospheric warming
2B) discrepancies between model-based projections vs. observational analyses occur post-1998 instead of throughout the tropospheric temperature trend record, coinciding with errors in inputted forcings
2C) Santer et al. 2017’s statistical, model-based test using a proxy of each model’s sensitivity
2D) models fairly accurately represent the temperature response to volcanic eruptions
2E) mitigated bulk tropospheric warming relative to surface warming would point to increased sensitivity, not reduced sensitivity
2F) Christy’s decades-long history of prematurely leaping to A4-model-error as an explanation, when other explanations were instead correct
2G) estimates of sensitivity near or above those of climate models
LikeLike
Tony Heller & his articles would refute anything you have to say about historic climate data sets & how NASA & NOAA once respectable gov. orgs. have finagled data of past temperature charts & climate models data GIGO to show increase in temperatures to match the CO2 increases in earth’s atmosphere. You and these other AGW scientists that either deliberately or ignorantly deceive the public with incomplete climate data& fraudulent derived temperature data fit the saying “IF YOU CAN NOT DAZZLE THEM WITH BRILLIANCE THEN BAFFLE THE WITH BS”
LikeLike
I never use anything but data that is available to the science community and other public inquiries
Heller believes in the same open space and does not parse any information that can be verified and replicated as any good scientist would do
LikeLike
Thank you for your intelligent rebuttal to the smear campaign against Heller. Who sponsors all these “fact-checking” websites? They are such a disgrace to humanity.
LikeLike
Well, if you climate alarmists truly believe your own BS then be the first to change your ways.
WALK the way rather than just talk the talk.
Your delusional AGW/CO2 BS has been disproven so many times and in so many ways, it’s pointless trying to wake up those who are intellectually dead.
Especially given that your own messiah Al Gore’s Inconveneint Truth (ie lie) video has been PROVEN to be factually incorrect, and that’s YOUR OWN data BTW.
You want to deny your own data ????????
Same crazy nonsense since the 1930’s all of which failed to materialise as has E-V-E-R-Y single AGW/CO2/alarmist claim.
Go study history, socio-political/environmental/GSM/cycles. Take your pick.
Reality is real – AGW/Co2/”climate change” alarmism is total BS.
NEXT year (2020) when your food is gone, maybe you’ll still be alive long enough to see the error of your beliefs.
Halleluya brother – I believe the BS because I WANT to believe the BS.
97% consensus ? What school did you go to that teaches consensus is science?
Oh the list is so long it would fill a book, and indeed has.
What the hell – I’m right – best of luck to your flat earth zombies though.
heh, yeah
LikeLiked by 2 people
It’s 2020 – is our food gone yet?
LikeLike
You sound mentally handicapped
LikeLike
nope, just a retired geophysicist who understands how pitifully inept and non-unique the forward and stochastic climate and geophysical models really are…..really saddens me that we don’t understand that we are in a potential energy crisis and not a climatic one
LikeLike
it is PC to say mentally challenged instead….LOL
LikeLike
As a Progressive Climate Scientist since 1980 I find that commentary from Tony Heller to be absolutely correct and fraudulent models (proven since 2009) from some climate scientists to be an absolute joke…Your modeling algorithms’ are non-unique and the trend line can be as you predict or something totally different, just remember your Algebra II class where if you have more unknowns, climate parameters, than equations to solve for them then your answer cannot be a unique.
LikeLiked by 2 people
Your clumsy use of mathematical language shows that you are absolutely NOT a climate scientist.
LikeLike
will put my 40 years of forward modeling experience as proof to the non-uniqueness of most of their published results….statistical crapola!!!
LikeLike
Funny how I can’t find any reference to a climatologist by the name of John Batson, nor any published papers. Who did you work for?
You do understand that their models come with associated probabilities, right? Apparently you’ve never heard of a probability distribution, instead believing everything is a black and white prediction. If you were indeed a climate scientist, you would be using the word ‘project’ rather than ‘predict’.
LikeLike
“As a Progressive Climate Scientist since 1980”
It’s hilarious how bad you are at lying. I’d have assumed this was satire if it wasn’t written so poorly.
LikeLike
maybe my satire is just a cover up for disgust at the catastrophists who are milking the gullible WOKE public out of trillions to pursue their own sick agendas,,,,,and by the way I have voted Democratic or Green since 1980
LikeLike
and actually I worked for a living and was an actually user of these clumsy geophysical and mathematical models…..didn’t feel compelled to write useless papers that are never cited as is the case with 95% of research, dissertations and thesis
LikeLike
John Batson (Red icon)
Who did you work for and what specifically was your job?
LikeLike
I was Manager of Geophysics
LikeLike
At …?
LikeLike
John Batson (Red icon) :
Whenever you’re ready ….
LikeLike
The link below gives a nice analysis of how the figure that compares models with satellite data is misleading:
http://www.realclimate.org/index.php/archives/2016/05/comparing-models-to-the-satellite-datasets/
LikeLike
When is the woke garbage going to go away? I am so tired of all the selfish, demented, hateful, disturbed, money-greedy, bored woketards.
LikeLike